After three diversity reports spanning four quarters, NBN has started to find its footing when it comes to releasing them. Generally, we aim to publish in the first half of the next quarter. Our staff is improving at aggregating and analyzing the data as we publish more reports, so we hope this goal stays consistent. The goal of this report is to hold NBN accountable for the demographic makeup of its staff and examine areas for improvement.
Unfortunately, the number of respondents has hit an all-time low since we started sending out a quarterly diversity survey in Fall 2020. Only 56 staffers or contributors responded to the Winter 2022 survey compared to 73 in Fall 2021, a drop of almost 25%.
As in past diversity reports, we do not distinguish between our print and web staff or contributors. This quarter, web staff was only 10% larger than print staff; in previous quarters, web staff has been up to 50% larger. A lack of web staff and contributor responses may have impacted the lower number of overall responses this quarter.
Race & ethnicity
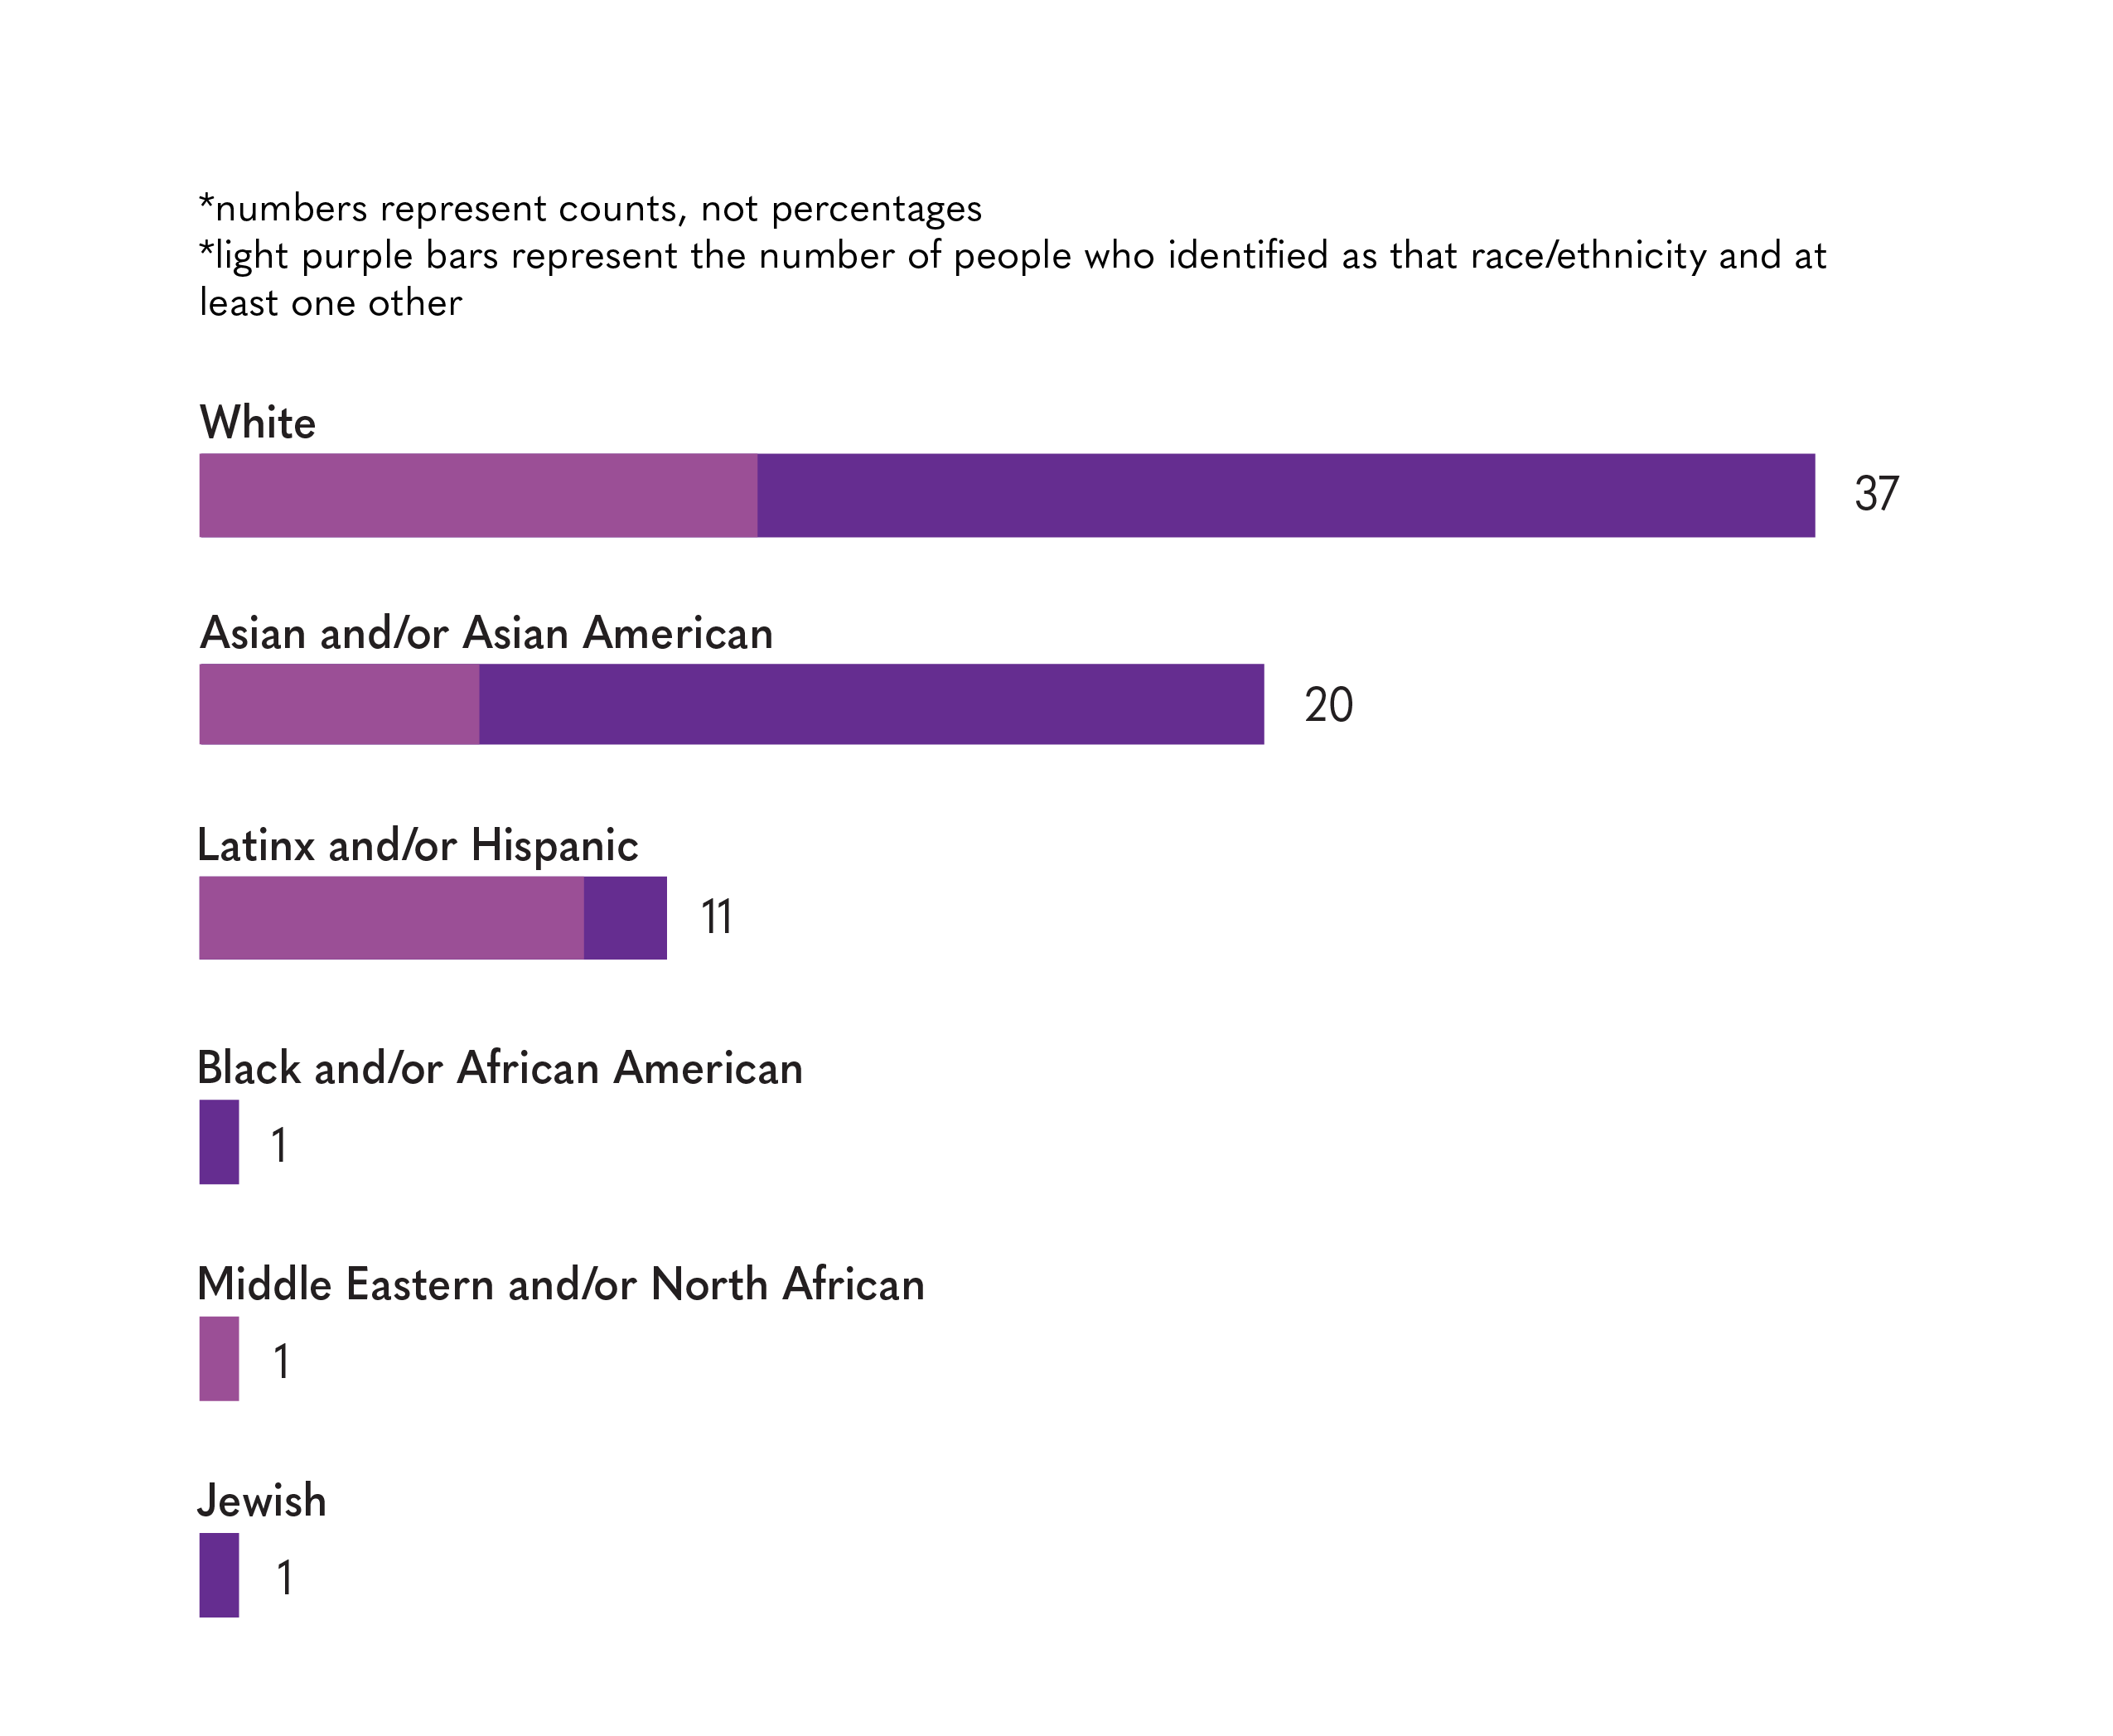
Unsurprisingly, NBN’s staff was once again majority-white last quarter. The number of staffers who only identified as white dropped by four, but the percentage went up by around one percentage point – from 43.8% to 44.6% – due to higher drops in the number of respondents of other races. The percentage of staff who identified as white and another race increased from 12.3% to 21.4%. Of the 12 responses included in this group, eight of them identified as Latinx / Latine / Hispanic and white.
The number of Latinx / Latine / Hispanic respondents stayed consistent, dropping from 11 to 10, but the percentage increased from 13.7% to 19.6%. Like the increase in the percentage of white-only staffers, this can be attributed to a decrease in respondents of non-Latinx / Latine / Hispanic respondents.
The percentage of Asian respondents was relatively similar from the Fall to the Winter, dropping slightly from 37.0% to 35.7%. While there were seven fewer Asian respondents, the similar percentages indicate that Asian students took the survey at generally similar rates in the Fall and Winter. NBN has continued to ask Asian students for subgroup identifications in order to provide disaggregated data. While East Asians remain the majority out of all the Asian respondents at NBN, the number of East Asian students fell from 18 in Fall to 12 in Winter. The number of both South and Southeast Asian students only dropped by one. This means that East Asians made up 60.0% of all Asian students at NBN in the Winter rather than 66.7% in the Fall.
Last quarter, NBN described students who indicated East Asian, South Asian or Southeast Asian as one of their races as “Asian American.” Going forward, NBN will describe these students as simply “Asian” to acknowledge that we cannot confirm whether all or most Asian students at NBN identify as Asian American without compromising the anonymity of the diversity survey. Past diversity surveys will not be updated in an effort to remain transparent on our newsroom’s shortcomings and efforts to grow.
Once again, the number of Black / African American staffers at NBN was extremely low. Only one person identified their race as Black / African American in the Winter diversity survey, compared with three in the Fall. Executive leaders at NBN know anecdotally that there was more than one Black staffer or contributor last quarter despite the results of the survey, which – combined with the record-low number of respondents – indicates that staff needs to work harder to garner more survey responses. Still, NBN has continuously failed to bring in large numbers of Black contributors to its newsroom.
According to data from the University for the 2020-21 school year, the total undergraduate population at Northwestern is 41.5% white, 19.6% Asian, 13.0% Latino/Hispanic, 5.9% Black and/or African American and 6.3% two or more races. The data also indicated that among the undergraduate population, there are only seven American Indian or Alaska Native students and only two Native Hawaiian or other Pacific Islander students, although anecdotal evidence from NBN staffers suggests these numbers may be underreported. The data did not record the overlapping identities of students who identified as Latino / Hispanic or who identified as more than one non-Hispanic race, which makes direct comparison difficult.
Based on the data, NBN’s newsroom overrepresents white, Asian and Latinx / Latine / Hispanic students and underrepresents Black / African American students compared to the overall undergraduate population at NU. This may be a result of the 6.3% of NU students who are two or more races and whose actual races NU did not record; NBN allows its staffers to select as many races and ethnicities as apply to them, which may elevate percentages across the board compared to official University data.
Gender identity
The data we collected from the Winter 2022 survey followed in the same vein as the major and minor breakdowns from the Spring-Fall 2021 Diversity Report. We gave our staffers the option to select more than one response for this question in an attempt to acknowledge that gender identity is fluid and lies on a spectrum.
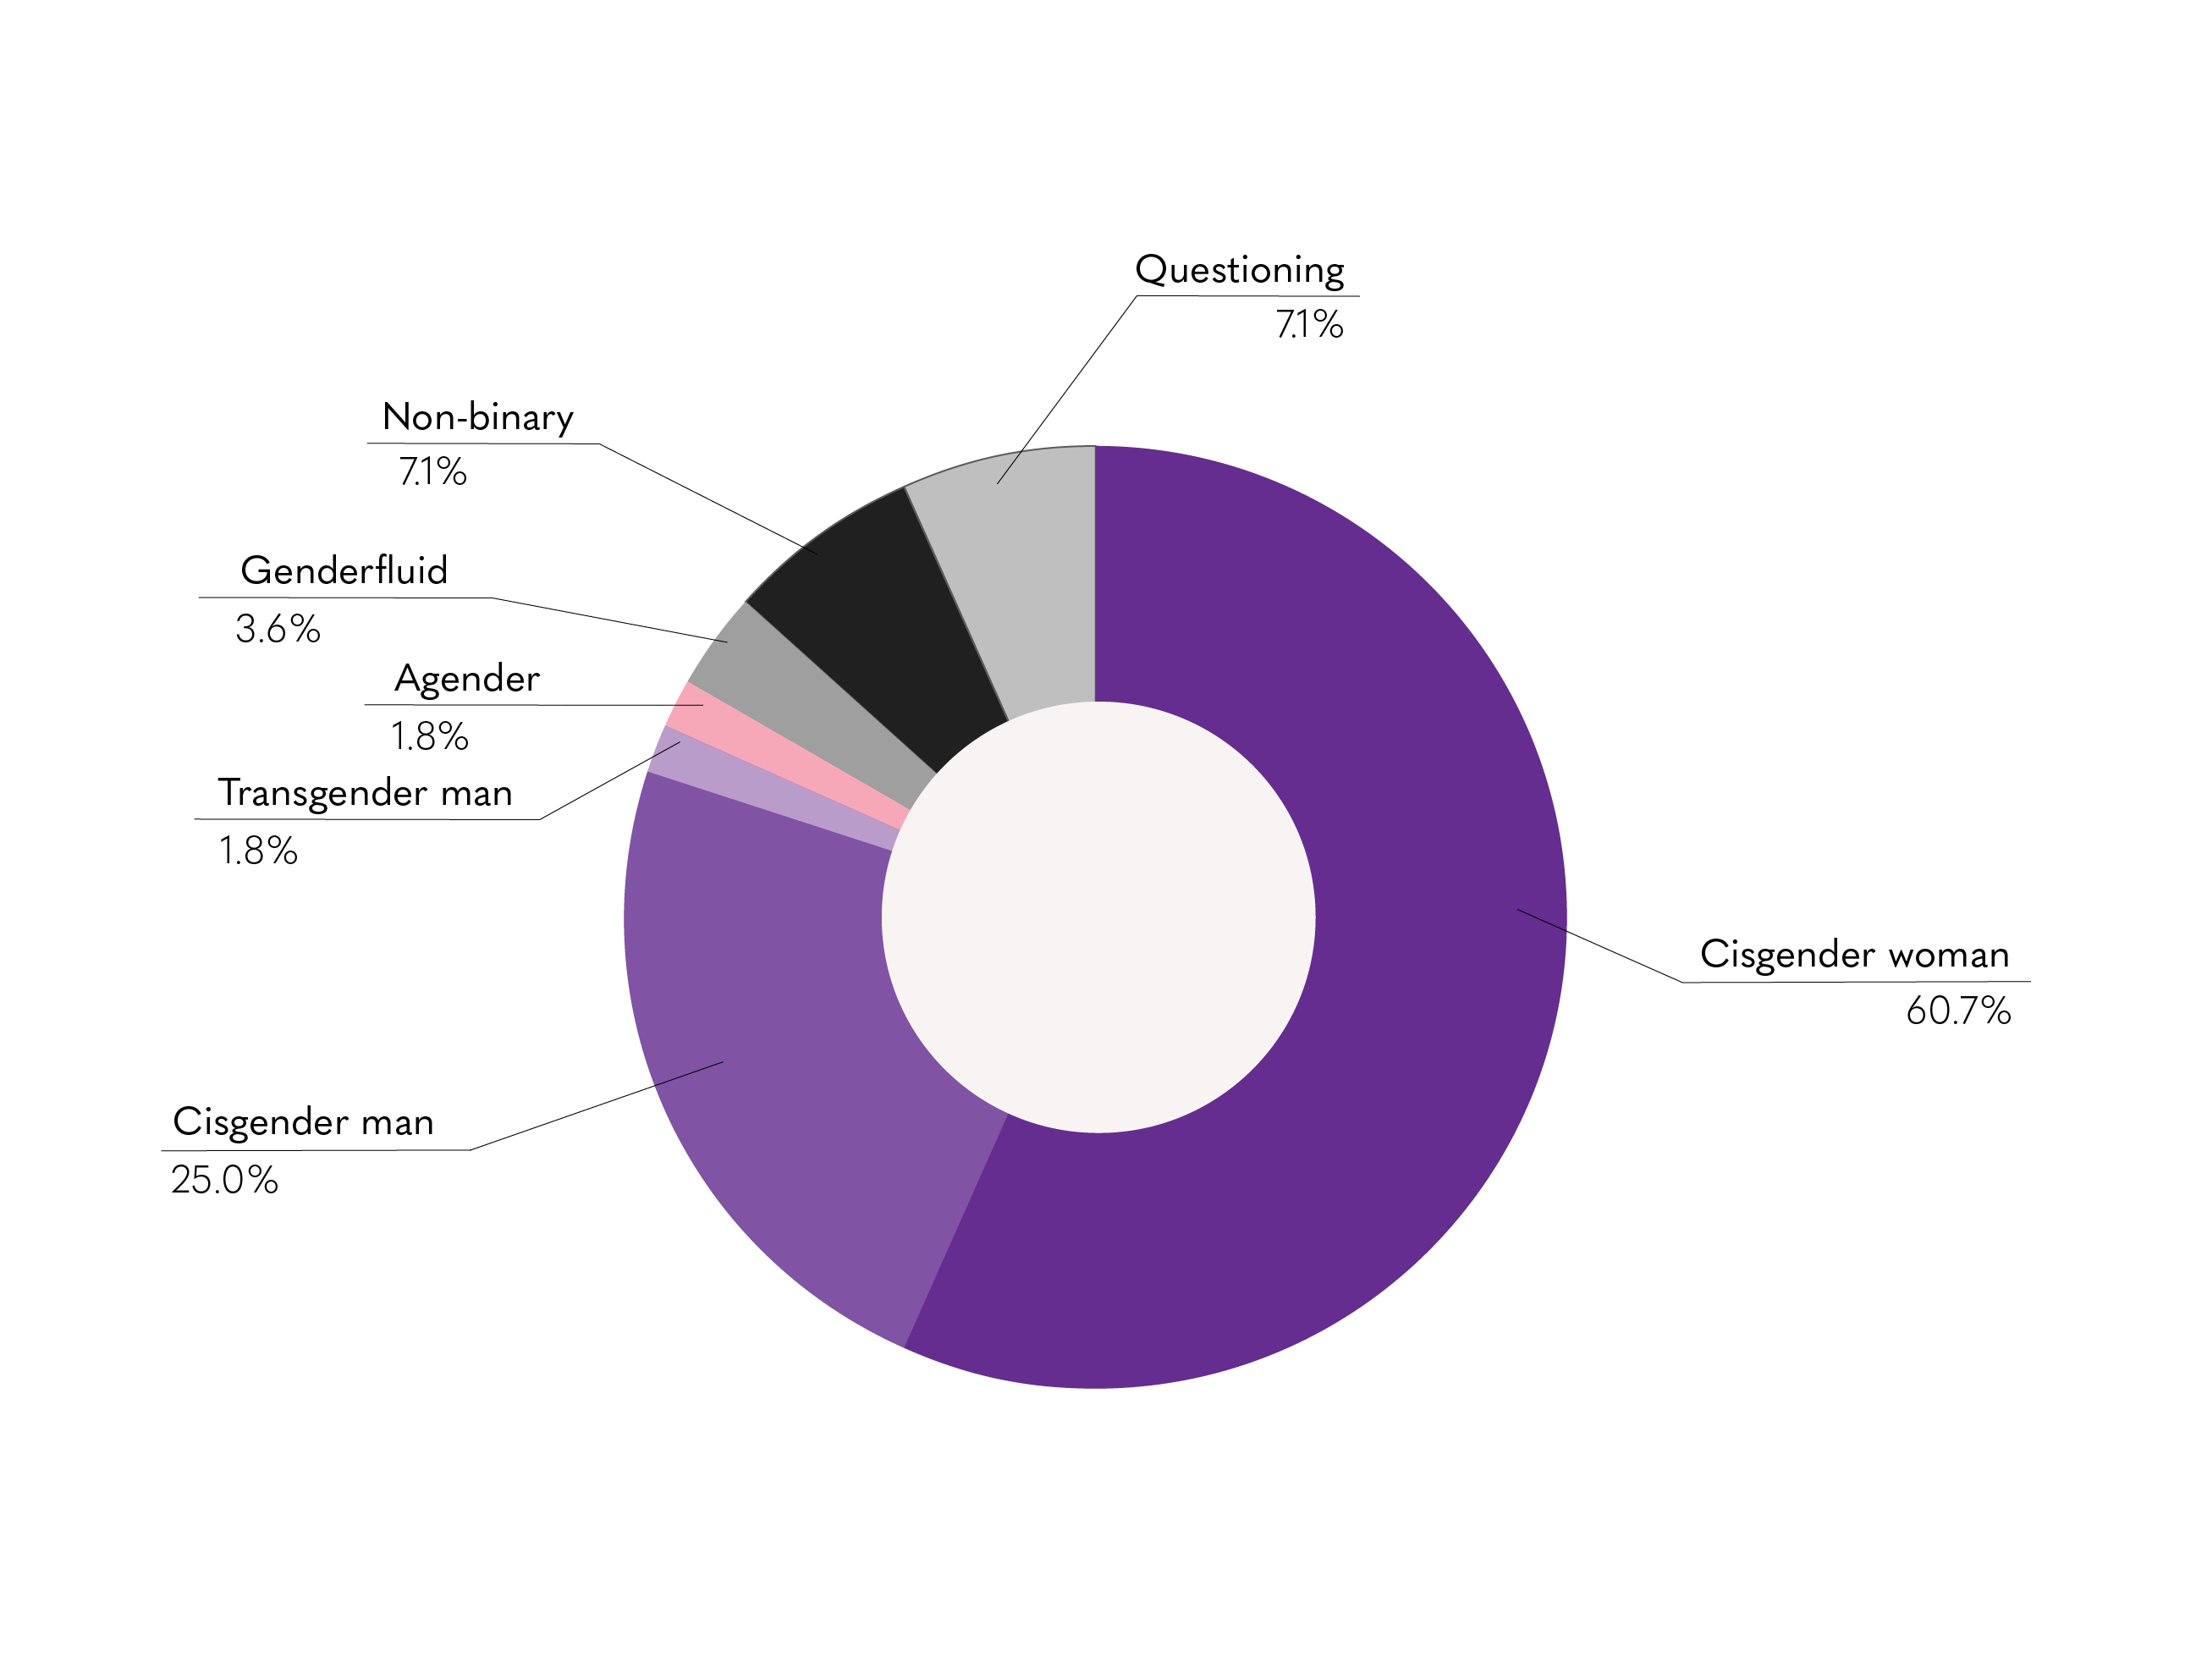
Following the trend of previous quarters, our newsroom remains predominantly woman-identifying, with 60.7% (34 staffers) identifying as a cisgender woman. This is a minor drop from 65.8% of staff in Fall 2021. On the other hand, the number of cisgender men on staff increased to 25% (14 staffers) from Fall (18 staffers, 24.7 of staff). Again, this statistic could be skewed due to a drop in respondents.
The percentage of staff who identified with a gender outside of the gender binary grew from 8.2% in Fall to 19.6% in Winter, with 1.8% identifying as agender, 3.6% identifying as genderfulid, 7.1% identifying as non-binary and 7.1% identifying as questioning. Each quarter, we provided staffers four options outside the binary options of man or woman: agender, genderfluid, gender-nonconforming and non-binary. For the Winter 2022 survey, allowed respondents to indicate if they were questioning their gender; discovering one’s gender is not a linear process and NBN recognizes that its members may still be coming to terms with their gender identities. It’s also important to note that starting from the Spring 2021 surveys, we have separated cisgender and transgender options to better identify the range of our staff’s gender identities.
In comparison to the overall Northwestern undergraduate population, cisgender women remain overrepresented at NBN. According to data from the University for the 2020-21 school year, 51.9% of undergraduate students are women and 48.1% are men. These numbers do not represent students whose gender falls outside the gender binary, which means they do not accurately represent the gender distribution of NU undergraduate students; however, this was the best resource NBN could find for comparison.
Sexuality
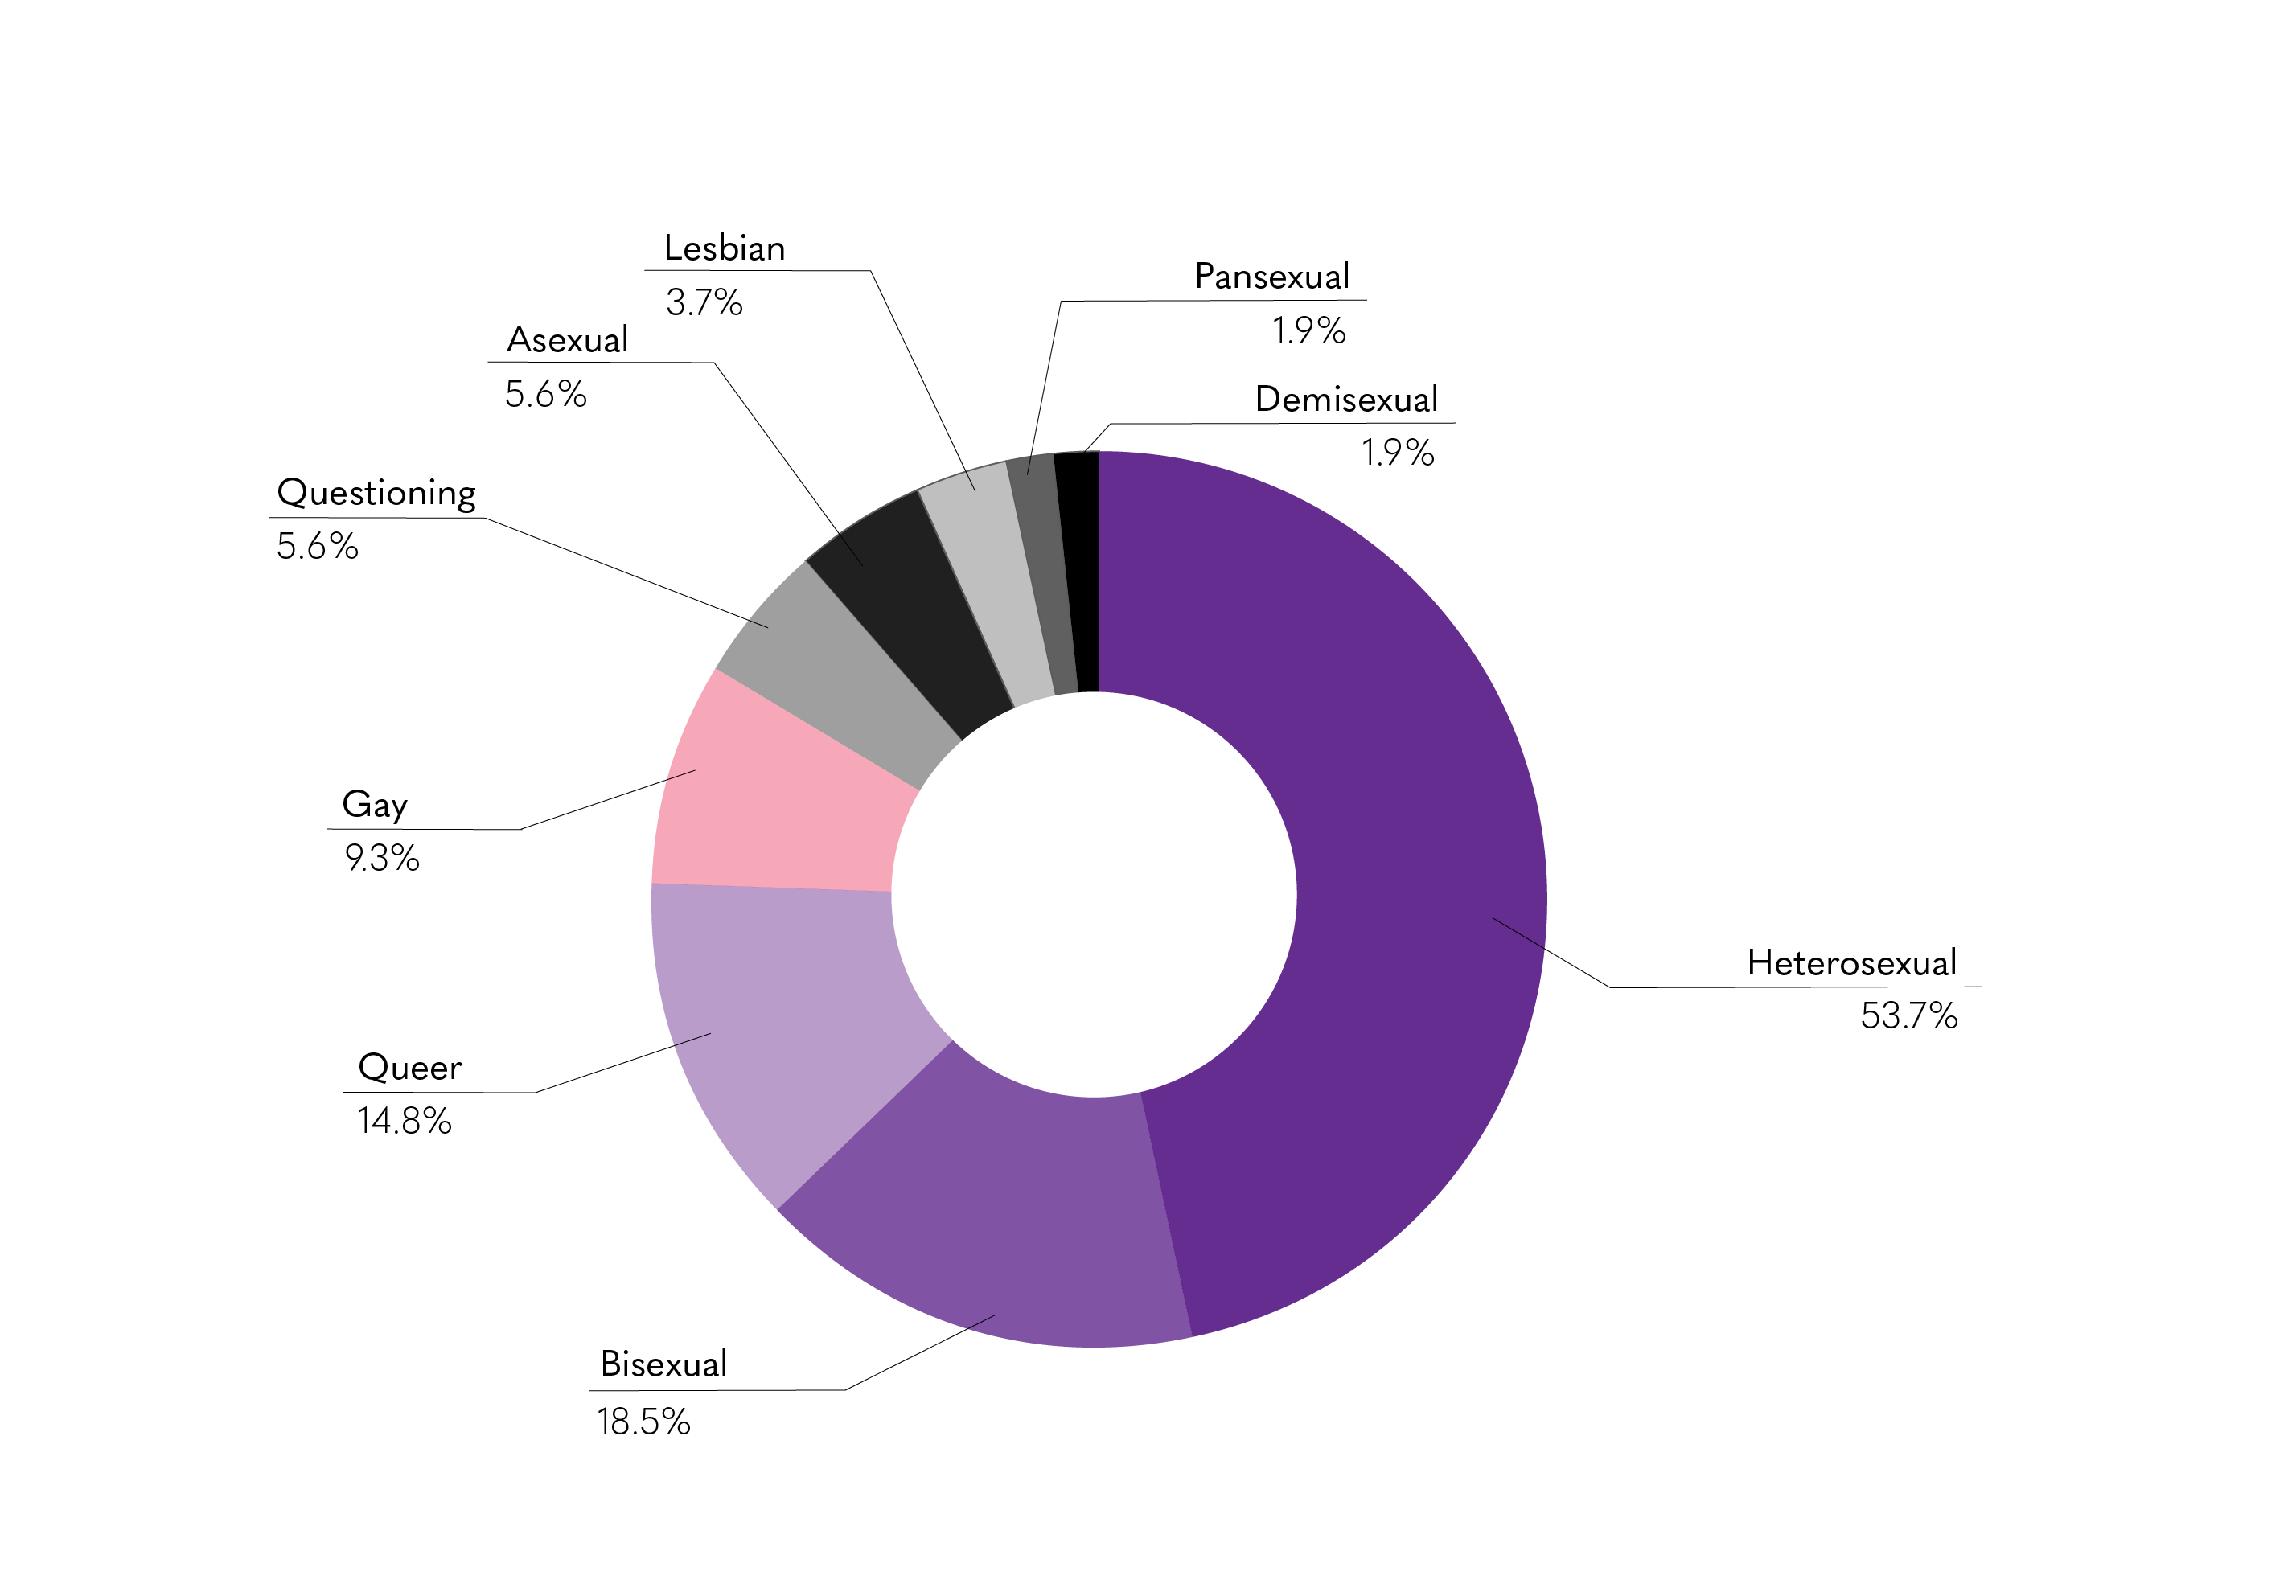
In the Fall, upward of 60% of NBN staff identified as heterosexual, but this figure fell to 53.7% in the Winter. This quarter, six respondents selected more than one sexuality – most of whom selected queer in addition to another sexuality – so the percentages may add up to more than 100%.
After heterosexuality, bisexuality was the most represented sexuality at NBN at 18.5% of staff. The biggest change from Fall to Winter fell under the queer label, which rose from 7.1% of staff in Fall to 14.8% in Winter. Each other sexuality fluctuated by 3% or less from its percentage in the Fall. Other sexualities besides these three each accounted for less than 10% of NBN staff; altogether, they accounted for about a quarter of staff. According to a 2021 study by Gallup, only 15.9% of Gen Z adults identify as LGBTQ+.
Notably, for the first time, NBN allowed respondents to identify themselves as questioning in addition to other sexuality labels. About 5% of staff indicated they were actively questioning their sexuality.
Language
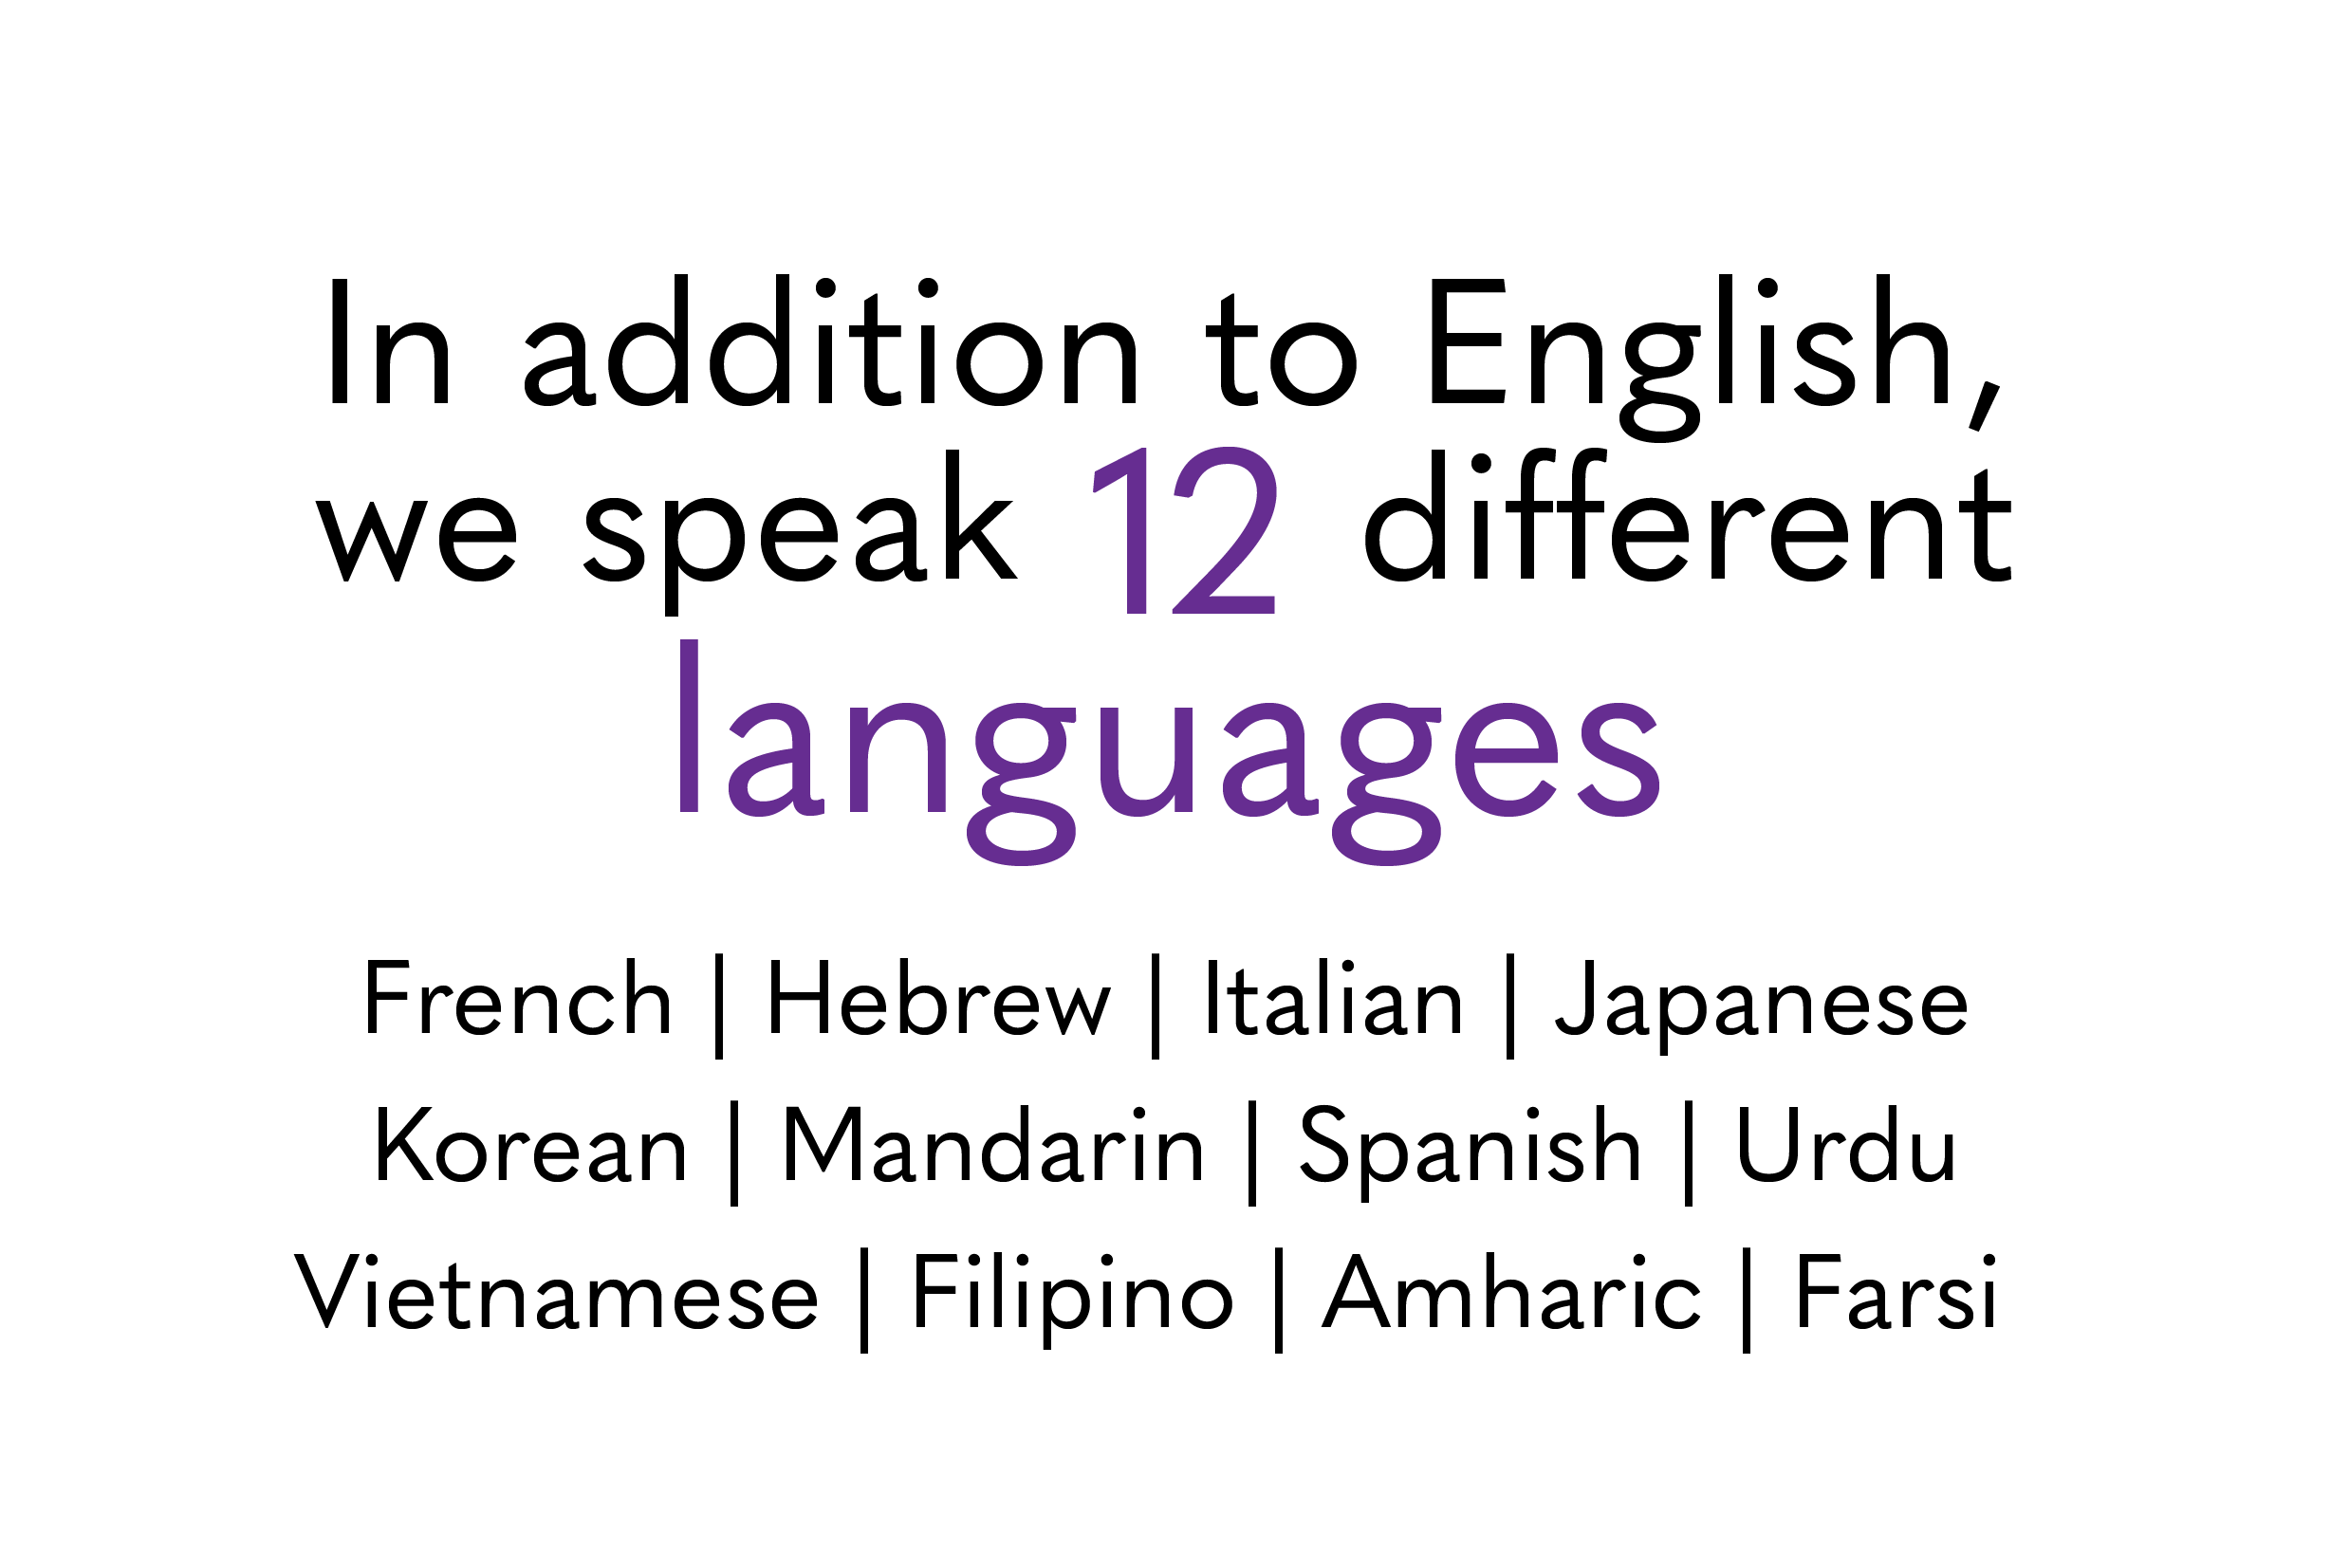
During Winter Quarter, members of the NBN staff spoke a total of 12 different languages other than English. Around 30% of our staff speaks Spanish, followed by Mandarin, with eight people reporting that they spoke the language. French was the third non-English language spoken most often, with five speakers on staff. NBN staff members also spoke Amharic, Farsi, Filipino, Hebrew, Italian, Japanese, Korean, Urdu and Vietnamese. This is the first quarter since NBN started collecting data that a respondent has spoken Amharic, Farsi or Filipino. In total, about 60% of NBN staffers spoke a language other than English.
International students
In the Winter survey, 5.4% of respondents indicated that they are international students. This percentage has continued to drop since this question was first included in the Spring 2021 survey (10.4% in Spring, 6.9% in Fall). As mentioned previously in the Spring-Fall 2021 Diversity Report, this is by no means representative of the undergraduate international student community at Northwestern. The Winter 2022 survey was the first time NBN gave international students the option to elaborate and indicate their country of origin to gain a better understanding of our international staff. Of the three respondents who indicated that they are international students, all three chose to indicate their country of origin as well. While we provided this option, we will not be publishing these responses out of respect for the privacy of our staff.
Socioeconomic background
First-generation students made up approximately 5.4% of staff in Winter, which cut the number of first-gen students on staff roughly in half compared to the 9.7% of students who identified as first-gen in the Fall. First-generation students continue to be underrepresented in NBN’s newsroom; according to a report by Northwestern, 13% of the class of 2023 and 13.2% of the class of 2024 are first-generation.
In Fall, 13.7% of staffers identified as low-income, which fell to 12.7% in Winter. In the Fall-Spring 2021 diversity report, we said that we hoped to collect data on how staffers balance NBN with jobs or other outside commitments as students from low-income backgrounds may need to spend more time working than other students to help their families or contribute to their tuition costs. We did not include this question in our Winter survey but hope to include it when we send the survey out again at the end of this quarter.
For the Winter Quarter, NBN continued to ask students whether they receive financial aid from the University in order to get a more holistic view of the socioeconomic background of our staff. About 55.4% of staffers said that they received financial aid from Northwestern, a drop from the 60.3% of staffers in Fall who received financial aid. This is the lowest percentage of students to report receiving financial aid since NBN started asking the question in Spring 2021. According to Northwestern, 61% of undergraduate students receive financial aid.
Religion
As has been the case for the past few quarters, respondents who identify as agnostic have remained the largest group with 17 total respondents. This number fell slightly in comparison to Spring and Fall (18 and 22 respectively). The second-largest group also remains respondents who identify as Christian; this number decreased from 19 in Fall to 13 in Winter. Those who identified as Jewish comprised the third-largest group with 11 respondents. Other respondents identified as Atheist (7), none (5), not practicing (5), spiritual but not religious (2) and Muslim (1). Six respondents indicated that they identified with more than one religious affiliation, while one respondent chose not to answer this question.
Disability
Of the 56 survey respondents, 14.5% said that they have a disability. Though the percentage of those answering they did have a disability increased from 12.3% in Spring-Fall to Winter, the number of staffers that have a disability stayed consistent (8). This distribution is slightly greater than that of the Northwestern population; as of the 2020-21 school year, 12.3% of the undergraduate population was registered with AccessibleNU. While we recognize that not all disabled students at Northwestern are registered with AccessibleNU, this was the best metric North by Northwestern could find to compare our own data with. Of the eight respondents who indicated that they have disabilities, five chose to describe their disabilities in greater detail. While we provided this option, we will not be publishing these responses out of respect for the privacy of our staff.
Takeaways
This quarter, we have taken several concrete steps as a publication to increase our outreach and our efforts in diversity, equity and inclusion (DEI). For the second quarter in a row, Dr. Ava Thompson Greenwell led our mandatory DEI dialogue, which we again held during week three. As a follow-up to last quarter’s diversity report, NBN began tracking its sources for the first time. This Spring Quarter, we’re asking writers for the print magazine to send their sources an anonymous post-interview survey that resembles the internal survey this report is based on. We’re also asking writers for the website to ask their sources directly about their demographics and identity during interviews. At the end of the quarter, NBN’s executive staff will examine the results of each kind of source tracking and select one method for both print and web writers to use going forward. NBN will announce which form of source tracking works best for us as a publication in the Spring 2022 Diversity Report, to be published over the summer.
Last quarter, we announced that we would begin hosting affinity spaces for marginalized students. We had begun planning a first affinity space, but unfortunately, those plans fell through and NBN was not able to host the affinity space. We are disappointed that we weren’t able to follow through on this idea last quarter, but we hoped to make another effort this quarter to begin our affinity space program, led by our two new DEI advisors who were hired in Spring Quarter.
Additionally, last quarter, NBN said it would collect data on how many staffers balance working for NBN with another job. While we forgot to record these data in the Winter 2022 diversity report, we hope to record them in future reports starting with Spring 2022.
The biggest takeaway from this diversity report is the promotion of our diversity survey, which is currently underrepresenting our staff. Our efforts to be transparent about diversity, equity and inclusion cannot be 100% successful unless we are accurately reflecting all of our staff. In future quarters, we will be promoting diversity surveys to all of our writers and staffers more strictly, and aiming to have our reports available earlier in the quarter for more reflection.
Thumbnail and graphs by Esther Tang.